Make a Q-Q plot
plotQQnorm.RdMake a Q-Q plot
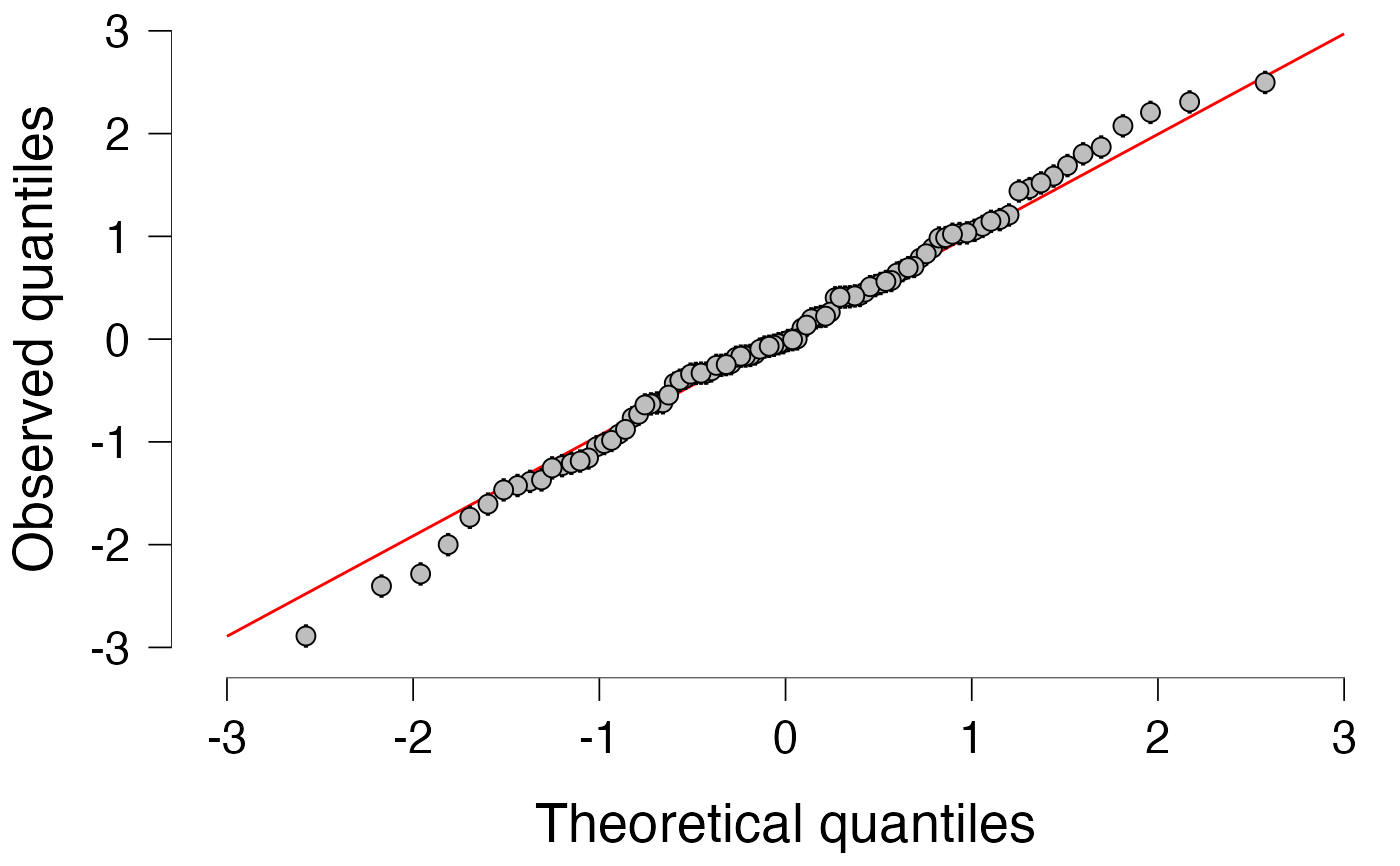
plotQQnorm(
  residuals,
  lower = NULL,
  upper = NULL,
  abline = TRUE,
  ablineColor = "red",
  xName = gettext("Theoretical quantiles", domain = "R-jaspGraphs"),
  yName = gettext("Observed quantiles", domain = "R-jaspGraphs")
)
Arguments
| residuals | Numeric vector, the residuals of the analysis. |
|---|---|
| lower | Numeric vector, lower confidence interval of each residual. If NULL, no error bars are drawn. |
| upper | Numeric vector, lower confidence interval of each residual. If NULL, no error bars are drawn. |
| abline | Logical, should an abline be drawn through the origin? |
| ablineColor | String, color of the abline. |
| xName | String, name for the x-axis. |
| yName | String, name for the y-axis. |
Details
This function is equivalent to qqnorm(residuals); qqline(residuals), but uses ggplot2 and allows for confidence bands.
Examples
x <- rnorm(100) jaspGraphs::plotQQnorm(x)# add a confidence interval for each point lower <- x - .1 upper <- x + .1 jaspGraphs::plotQQnorm(x, lower, upper)