Create a robustness or sequential plot
PlotRobustnessSequential.RdCreate a robustness or sequential plot
PlotRobustnessSequential(
  dfLines,
  dfPoints = NULL,
  BF = NULL,
  hasRightAxis = TRUE,
  xName = NULL,
  yName = NULL,
  addEvidenceArrowText = TRUE,
  drawPizzaTxt = !is.null(BF),
  evidenceLeveltxt = !is.null(BF),
  pointLegend = !is.null(dfPoints),
  linesLegend = !is.null(dfLines$g),
  bfSubscripts = NULL,
  pizzaTxt = hypothesis2BFtxt(hypothesis)$pizzaTxt,
  bfType = c("BF01", "BF10", "LogBF10"),
  hypothesis = c("equal", "smaller", "greater"),
  pointColors = c("red", "grey", "black", "white"),
  lineColors = c("black", "grey", "black"),
  lineTypes = c("solid", "solid", "dotted"),
  addLineAtOne = TRUE,
  bty = list(type = "n", ldwX = 0.5, lwdY = 0.5),
  plotLineOrPoint = c("auto", "line", "point"),
  pointShape = rep(21, 3),
  pointFill = c("grey", "black", "white"),
  pointColor = rep("black", 3),
  pointSize = c(3, 2, 2),
  evidenceTxt = NULL,
  arrowLabel = NULL,
  ...
)
Arguments
| dfLines | A dataframe with |
|---|---|
| dfPoints | A dataframe with |
| BF | Numeric, with value of Bayes factor. This MUST correspond to bfType. |
| hasRightAxis | Logical, should there be a right axis displaying evidence? |
| xName | String or expression, displayed on the x-axis. |
| yName | String or expression, displayed on the y-axis. |
| addEvidenceArrowText | Logical, should arrows indicating "Evidence for H0/H1" be drawn? |
| drawPizzaTxt | Logical, should there be text above and below the pizza plot? |
| evidenceLeveltxt | Logical, should "Evidence for H0: extreme" be drawn?
Ignored if |
| pointLegend | Logical, should a legend of |
| linesLegend | Logical, should a legend of |
| bfSubscripts | String, manually specify the BF labels. |
| pizzaTxt | String vector of length 2, text to be drawn above and below pizza plot. |
| bfType | String, what is the type of BF? Options are "BF01", "BF10", or "LogBF10". |
| hypothesis | String, what was the hypothesis? Options are "equal", "smaller", or "greater". |
| pointColors | String vector, colors for points if |
| lineColors | String vector, colors for lines if |
| lineTypes | String vector, line types if |
| addLineAtOne | Logical, should a black line be draw at BF = 1? |
| bty | List of three elements. Type specifies the box type, ldwX the width of the x-axis, lwdY the width of the y-axis. |
| plotLineOrPoint | String, should the main geom in the plot be a line or a point? If set to auto, points are shown whenever |
| pointShape | String, if |
| pointFill | String, if |
| pointColor | String, if |
| pointSize | String, if |
| evidenceTxt | String to display evidence level in the topright of the plot. If NULL then a default is used. |
| arrowLabel | String to display text next to arrows inside the plot. If NULL then a default is used. |
| ... | Unused. |
Examples
# Data for sequential # set.seed(1) n <- 100 dfLines <- data.frame( x = seq_len(n), y = c(0, rnorm(n - 1, seq_len(n - 1) / 30, .5)) # log Bayes factor ) # Sequential plot # PlotRobustnessSequential( dfLines = dfLines, xName = "n", )# Sequential plot add info # BF10 <- exp(tail(dfLines, 1)$y) PlotRobustnessSequential( dfLines = dfLines, xName = "n", BF = BF10, bfType = "BF10" )
# Data for robustness plot n <- 100 x <- seq_len(n)/100 y <- cos(pi*x) dfLines <- data.frame( x = x, y = y ) # Robustness plot # PlotRobustnessSequential( dfLines = dfLines, xName = "Prior width" )
# In JASP, we often prefer more information in the plot x <- dfLines$x[c(15, 30, 50, 80)] y <- dfLines$y[c(15, 30, 50, 80)] maxBFrVal <- x[1] maxBF10 <- y[1] BF10user <- y[2] BF10w <- y[3] BF10ultra <- y[4] BFsubscript <- "[0][1]" label1 <- c( gettextf("max BF%s", BFsubscript), gettext("user prior"), gettext("wide prior"), gettext("ultrawide prior") ) # some failsafes to parse translations as expressions label1[1] <- gsub(pattern = "\\s+", "~", label1[1]) label1[-1] <- paste0("\"", label1[-1], "\"") label1 <- paste0("paste(", label1, ", ':')") BFandSubscript <- gettextf("BF%s", BFsubscript) BFandSubscript <- gsub(pattern = "\\s+", "~", BFandSubscript) label2 <- c( gettextf("%s at r==%s", format(maxBF10, digits = 4), format(maxBFrVal, digits = 4)), paste0(BFandSubscript, "==", format(BF10user, digits = 4)), paste0(BFandSubscript, "==", format(BF10w, digits = 4)), paste0(BFandSubscript, "==", format(BF10ultra,digits = 4)) ) label2[1L] <- gsub(pattern = "\\s+", "~", label2[1]) dfPoints <- data.frame( x = x, y = c(maxBF10, BF10user, BF10w, BF10ultra), g = label1, label1 = jaspGraphs::parseThis(label1), label2 = jaspGraphs::parseThis(label2), stringsAsFactors = FALSE ) PlotRobustnessSequential( dfLines = dfLines, xName = expression(paste("Prior width ", kappa)), dfPoints = dfPoints )
# convenience function for showing plots side by side. You may need to click zoom in Rstudio # to properly view the plots. showSideBySide <- function(..., nrow = 1L, ncol = ...length()) { require(gridExtra) jaspgraphplot2grob <- function(x) { if (!inherits(x, "jaspGraphsPlot")) return(x) else return(x$plotFunction(x$subplots, args = x$plotArgs, grob = TRUE)) } gridExtra::grid.arrange(gridExtra::arrangeGrob( grobs = lapply(list(...), jaspgraphplot2grob), nrow = nrow, ncol = ncol)) } # arrow labels can be modified g1 <- PlotRobustnessSequential(dfLines = dfLines, arrowLabel = c("top", "bottom")) g2 <- PlotRobustnessSequential(dfLines = dfLines, arrowLabel = jaspGraphs::parseThis(c("alpha", "beta"))) showSideBySide(g1, g2) #> Loading required package: gridExtra
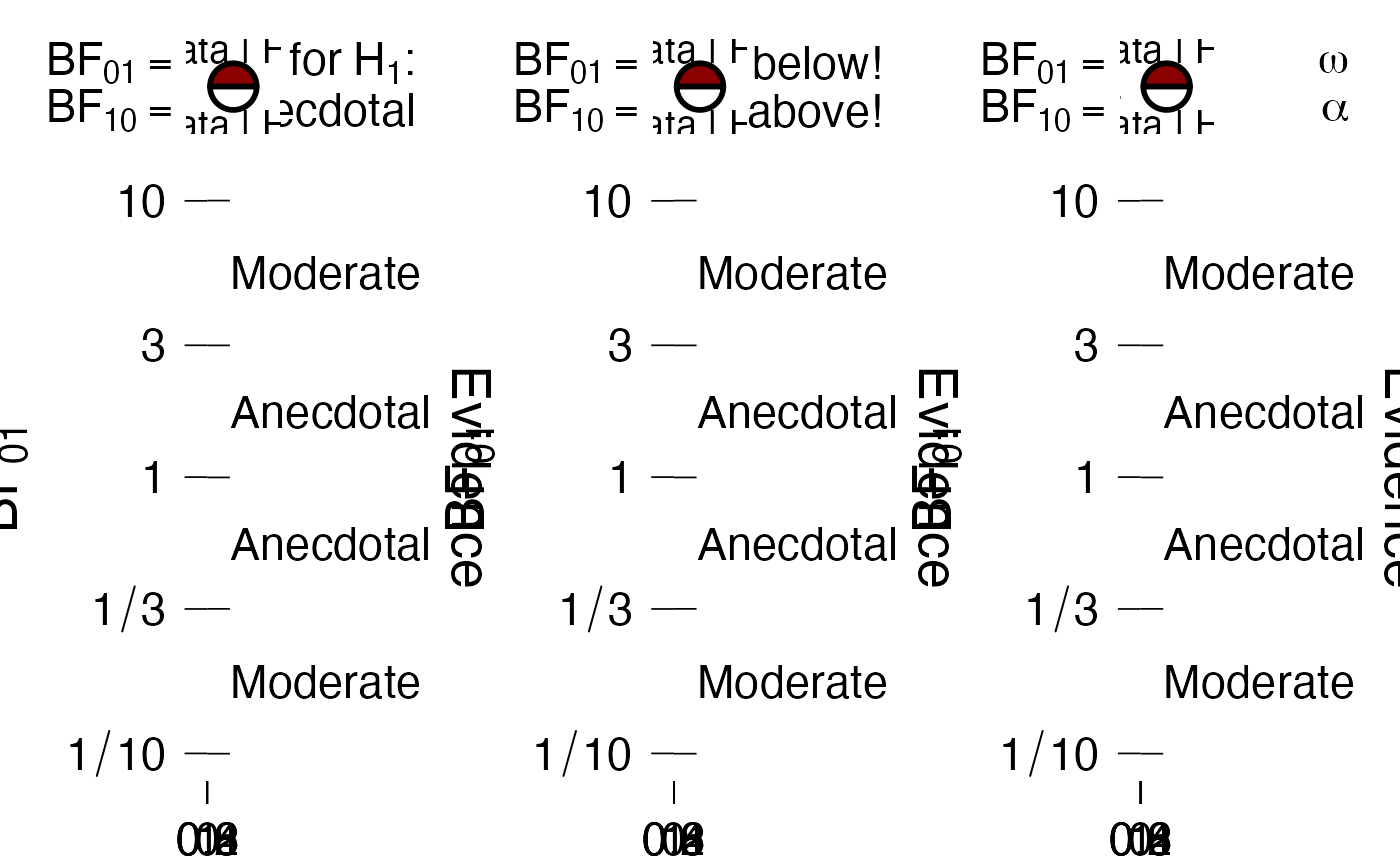
# text in the top right (evidence text) can be modified g1 <- PlotRobustnessSequential(dfLines = dfLines, BF = 1) g2 <- PlotRobustnessSequential(dfLines = dfLines, BF = 1, evidenceTxt = c("I'm above!", "I'm below!")) g3 <- PlotRobustnessSequential(dfLines = dfLines, BF = 1, evidenceTxt = jaspGraphs::parseThis(c("alpha", "omega"))) showSideBySide(g1, g2, g3)
